Configuring Controls
Overview
Controls are essential tools for filtering and refining data in your reports. They enable interactive data exploration and focused analysis through various filtering mechanisms.
Getting Started
Before configuring controls, ensure you have:
- A dataset with appropriate fields for filtering
- Charts added to your report
- Clear understanding of filtering requirements
Business Value
- Enable interactive data exploration
- Provide focused analysis capabilities
- Allow dynamic report customization
Control Types
Date Range Control
Configure time-based filtering:
- Control Title: Set meaningful name
- Dataset: Select data source
- Field: Choose date column
- Start/End Dates: Set boundaries
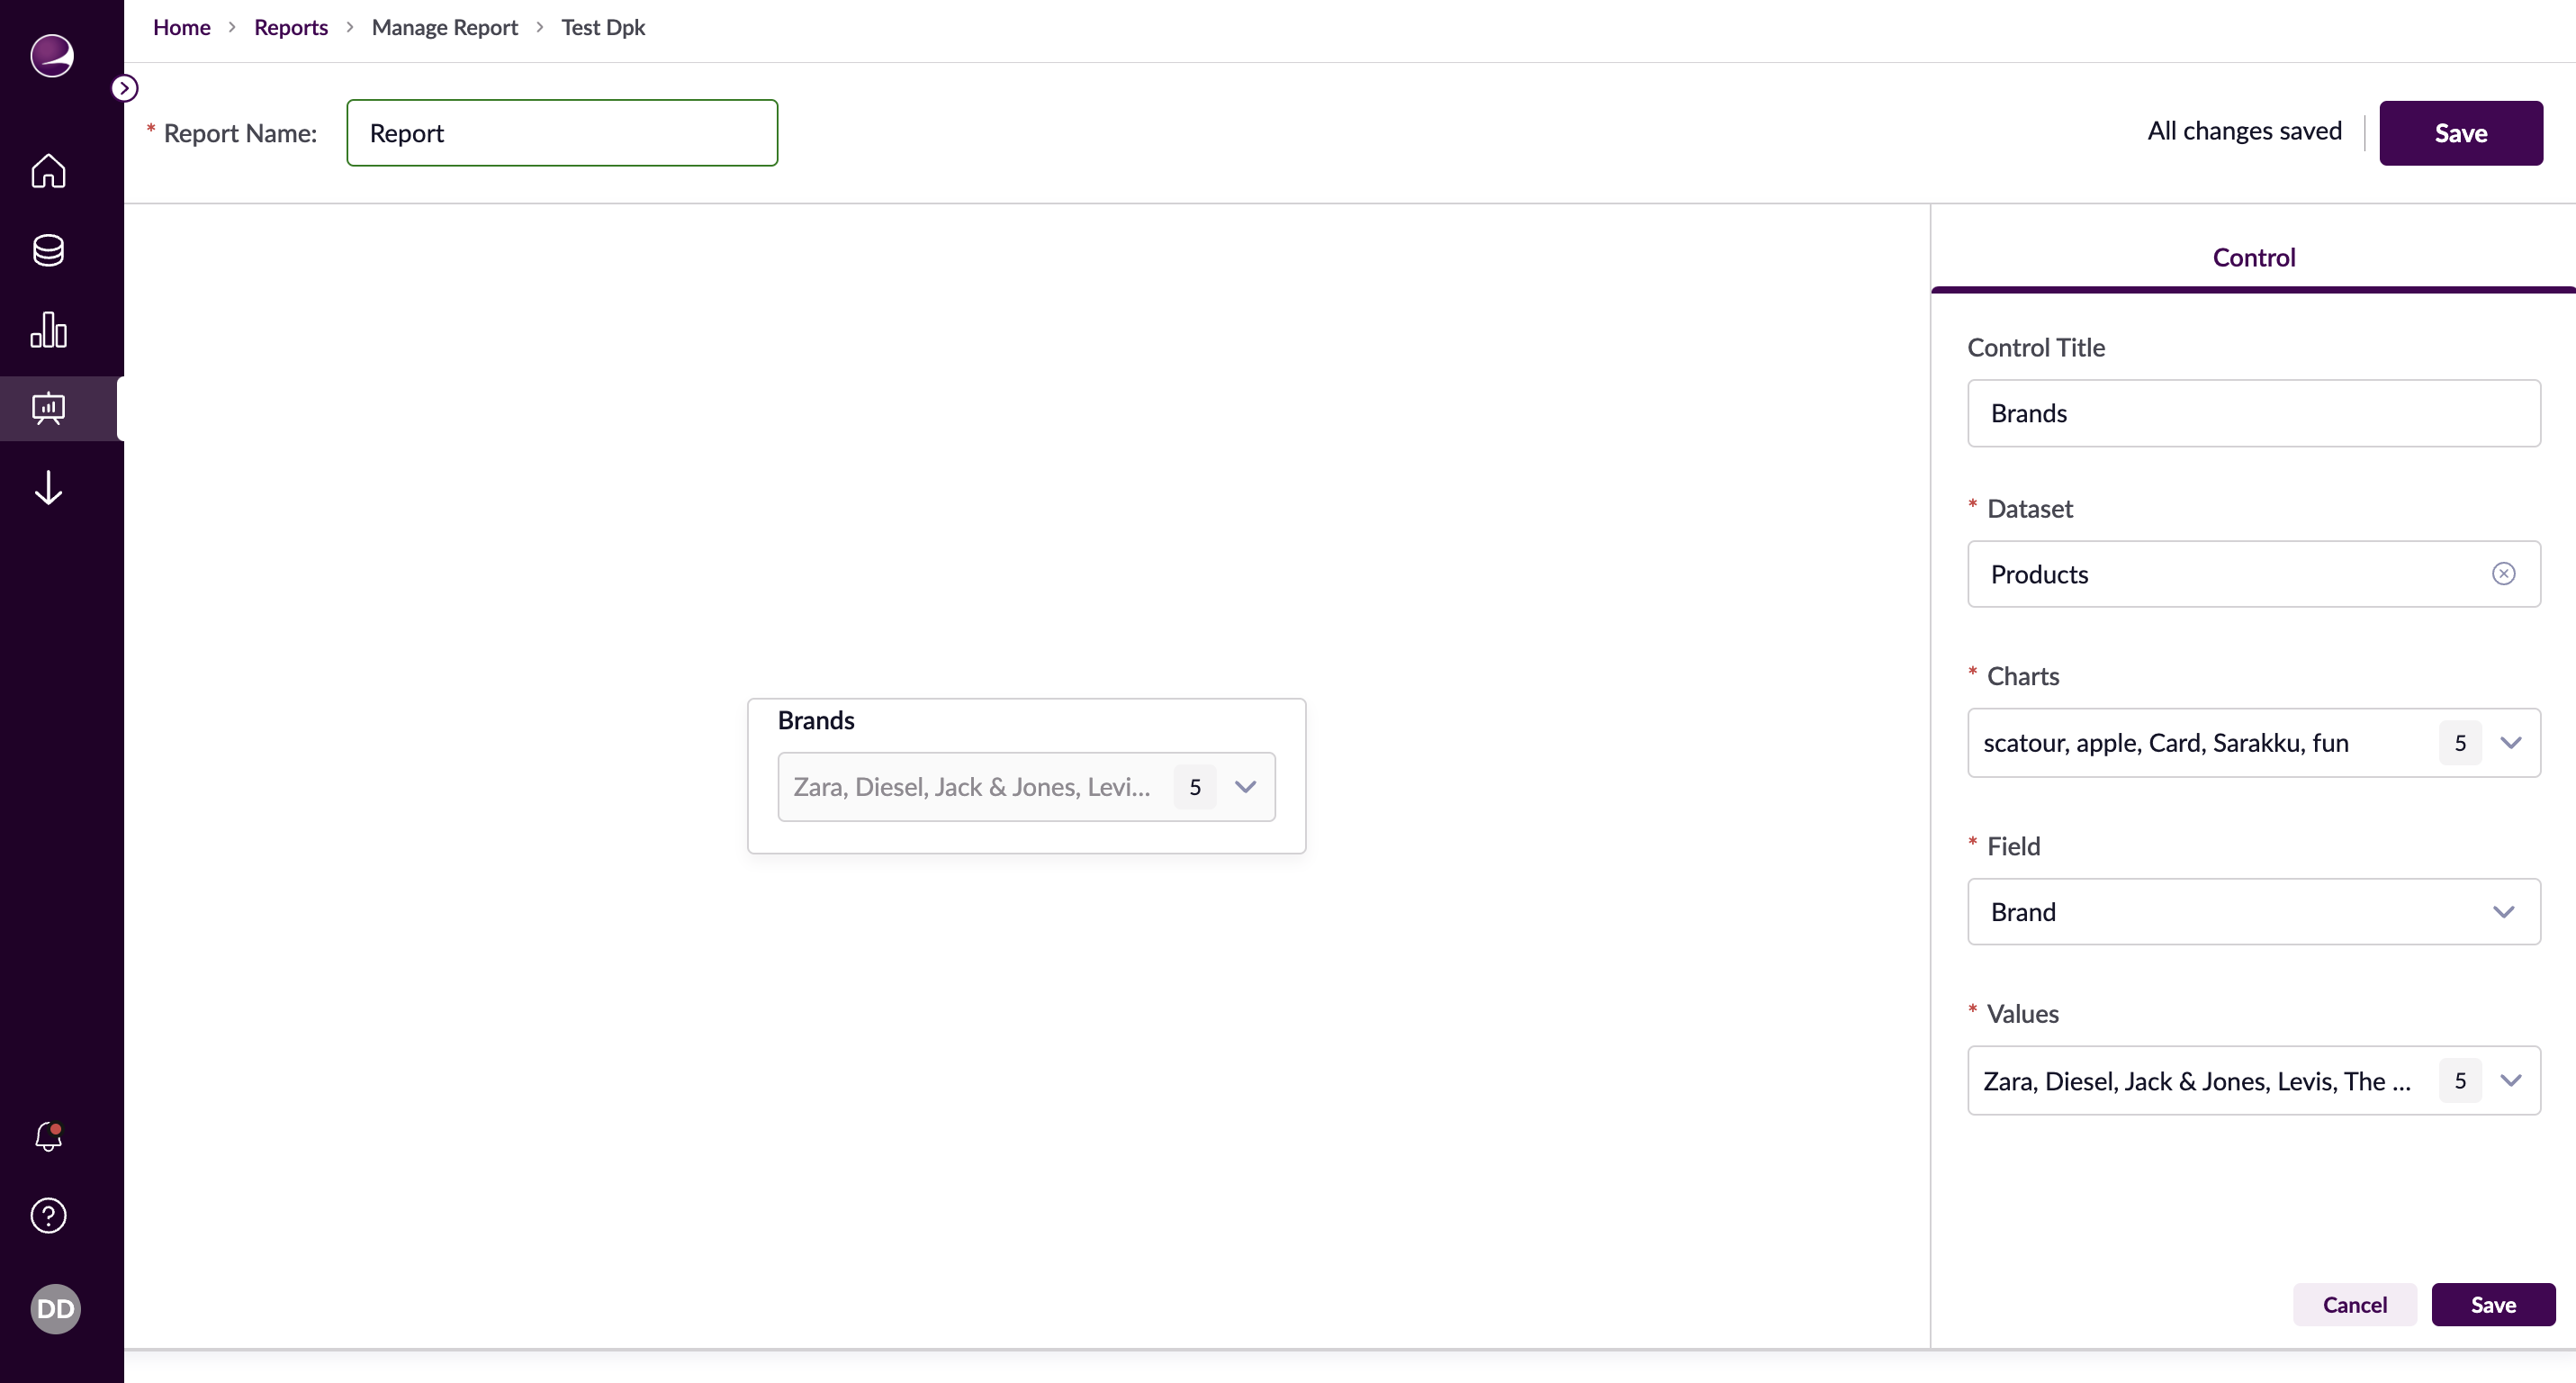
Dropdown Control
Enable categorical filtering:
- Control Title: Name your control
- Dataset: Choose source data
- Field: Select category column
- Values: Define available options
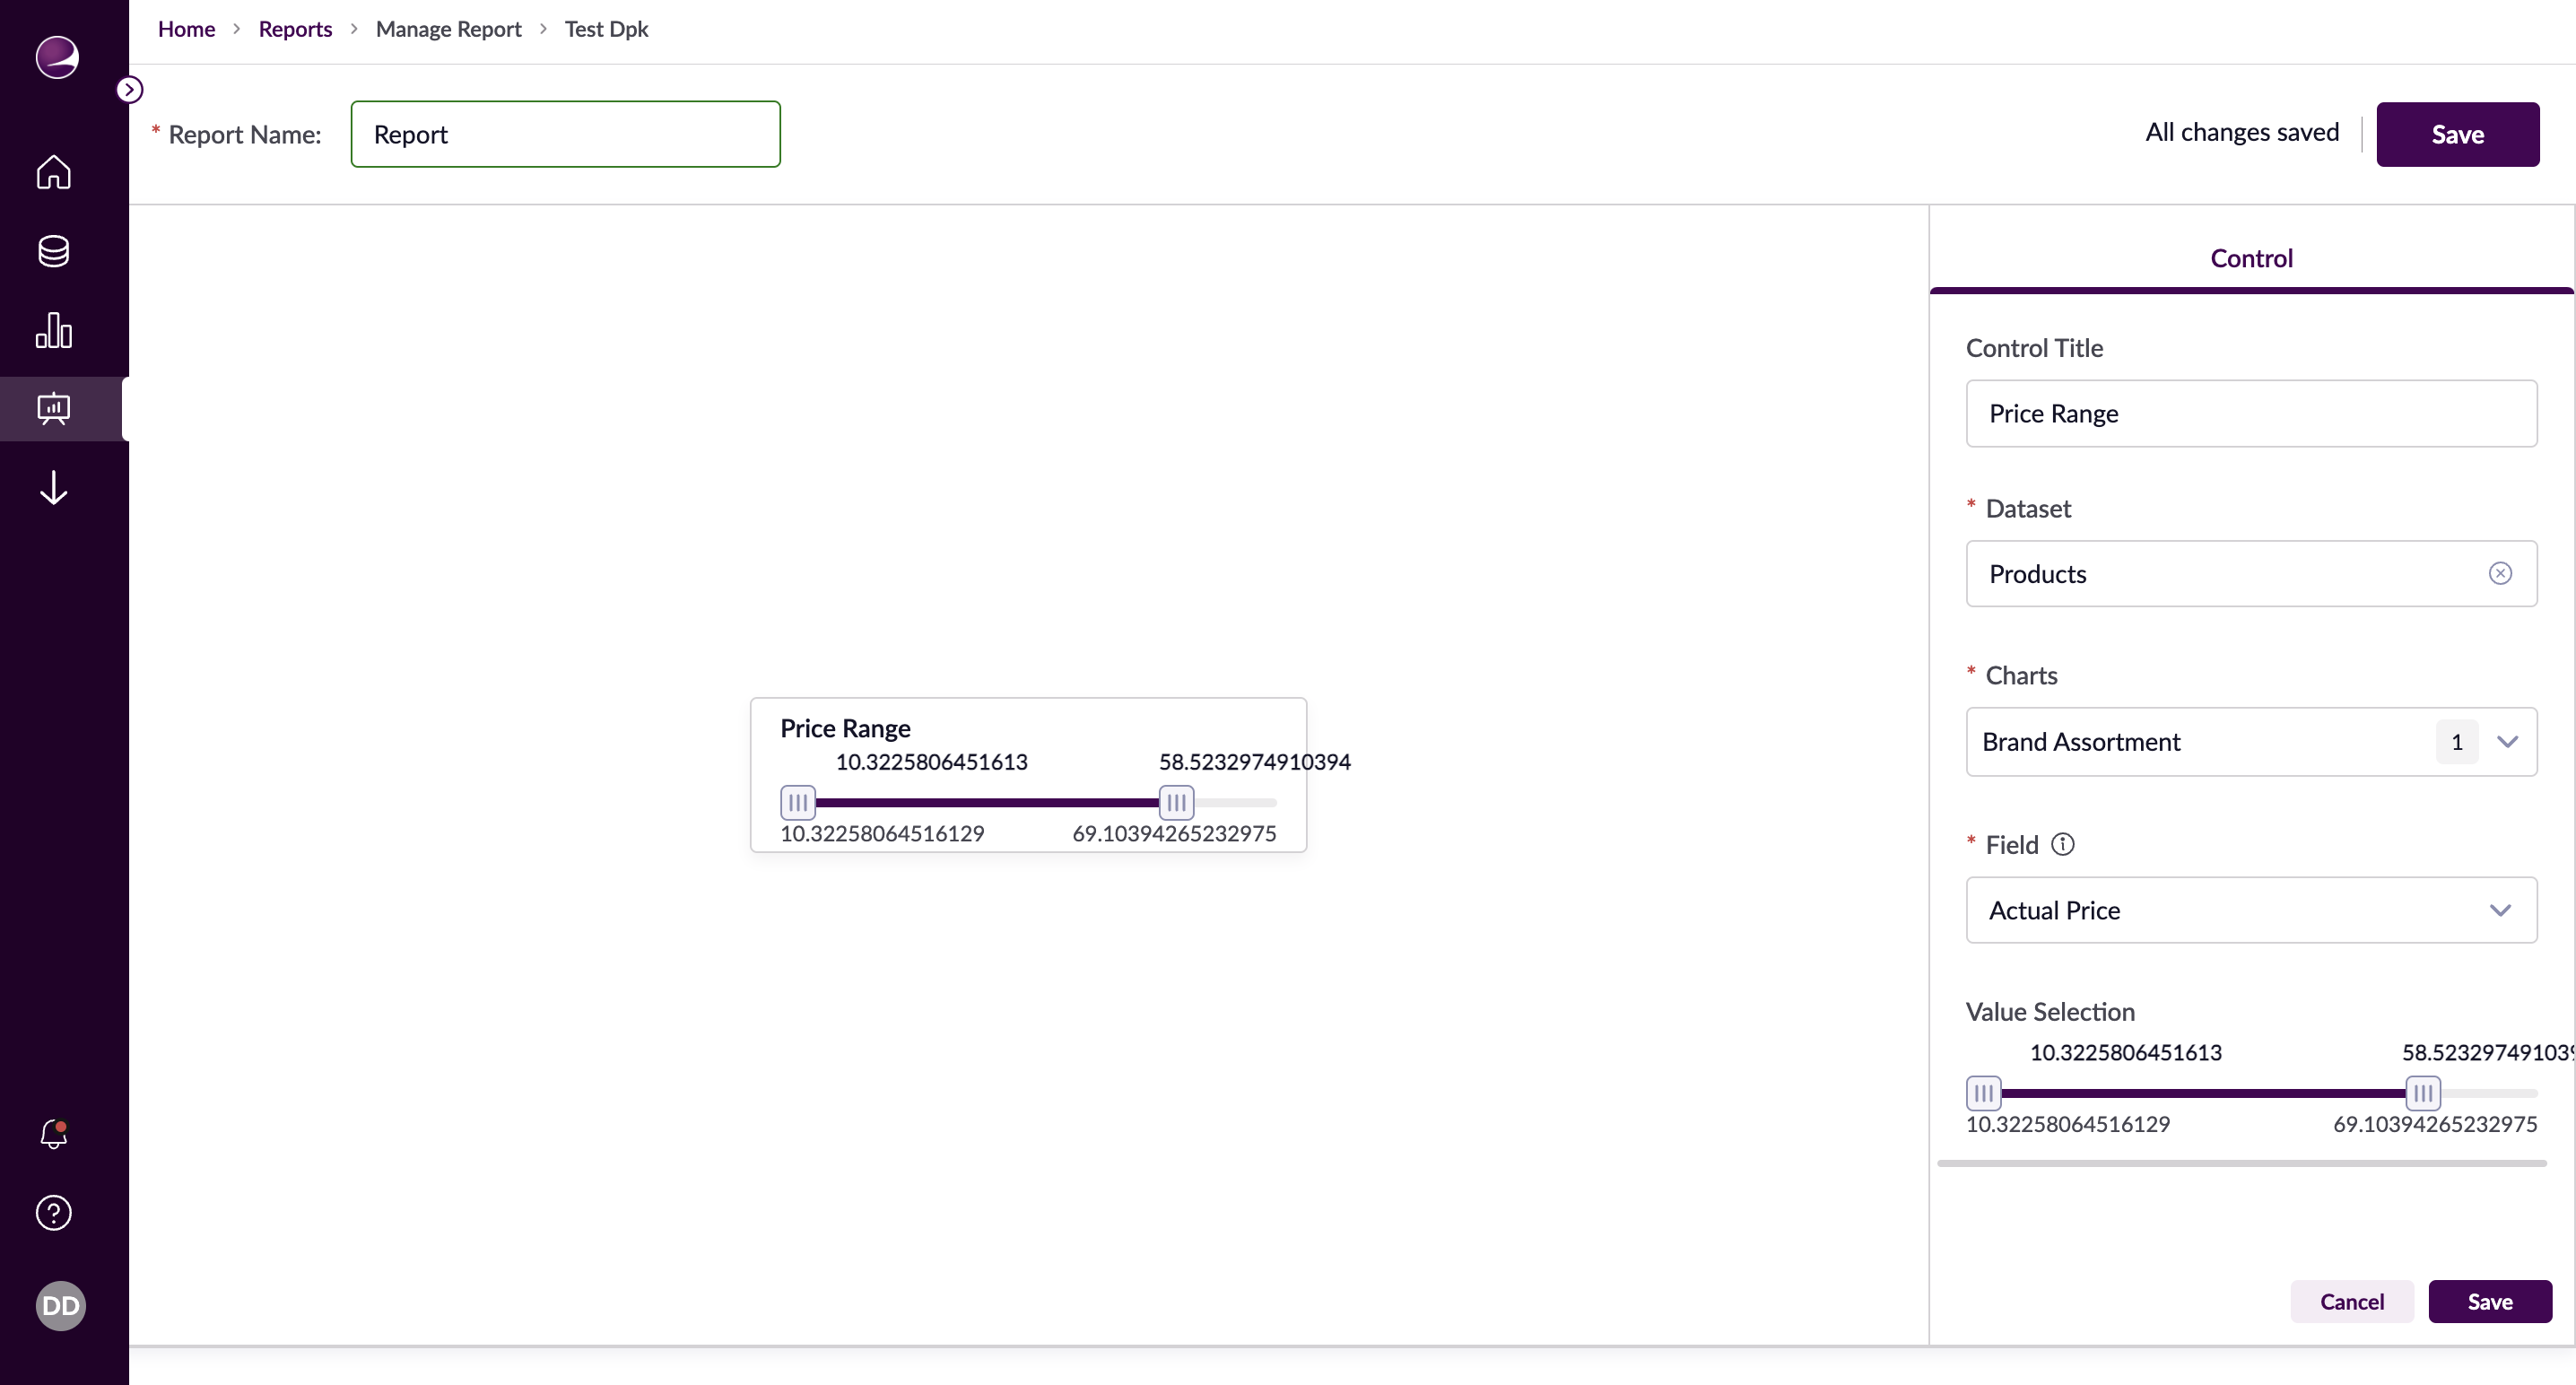
Range Slider Control
Configure numerical range filtering:
- Control Title: Set descriptive name
- Dataset: Select data source
- Field: Choose numeric column
- Min/Max Values: Set boundaries
Advanced Features
Chart Linking
- Select affected charts
- Configure update behavior
- Set default selections
Control Interaction
- Multiple control coordination
- Dynamic value updates
- Reset capabilities
Example Use Cases
Sales Period Analysis
- Control: Date Range
- Field: Transaction Date
- Charts: Revenue, Orders
- Purpose: Quarterly performance tracking
Product Category Filtering
- Control: Dropdown
- Field: Category
- Charts: Sales, Inventory
- Purpose: Category-specific analysis
Price Range Filtering
- Control: Range Slider
- Field: Price
- Charts: Products, Revenue
- Purpose: Price-based analysis